The battery bars are representing the status of the health (SOH) of the Nissan Leaf HV battery. In fact, this is a unique feature of Leaf. This is directly related to the battery warranty as well. Here are the warranties of popular EVs. ( It is to be advised not to solely rely on the battery bars and/or the SoH itself as there figures are manipulated by some resellers)
- Tesla Model 3 Long Range – 8 years, 125k miles – 70% capacity
- Kia Soul EV 27 kWh – 10 years, 100k miles – 70% capacity
- Tesla Model 3 Performance, BMW i3, VW e-golf, Mercedes B250 – 8 years, 100k miles – 70% capacity
- Nissan Leaf 30 kWh – 8 years, 100k miles – 66.25% capacity
- Chevy Bolt 60 kWh – 8 years, 100k miles – 60% capacity
- Nissan Leaf 24 kWh – 5 years, 60k miles – 66.25% capacity
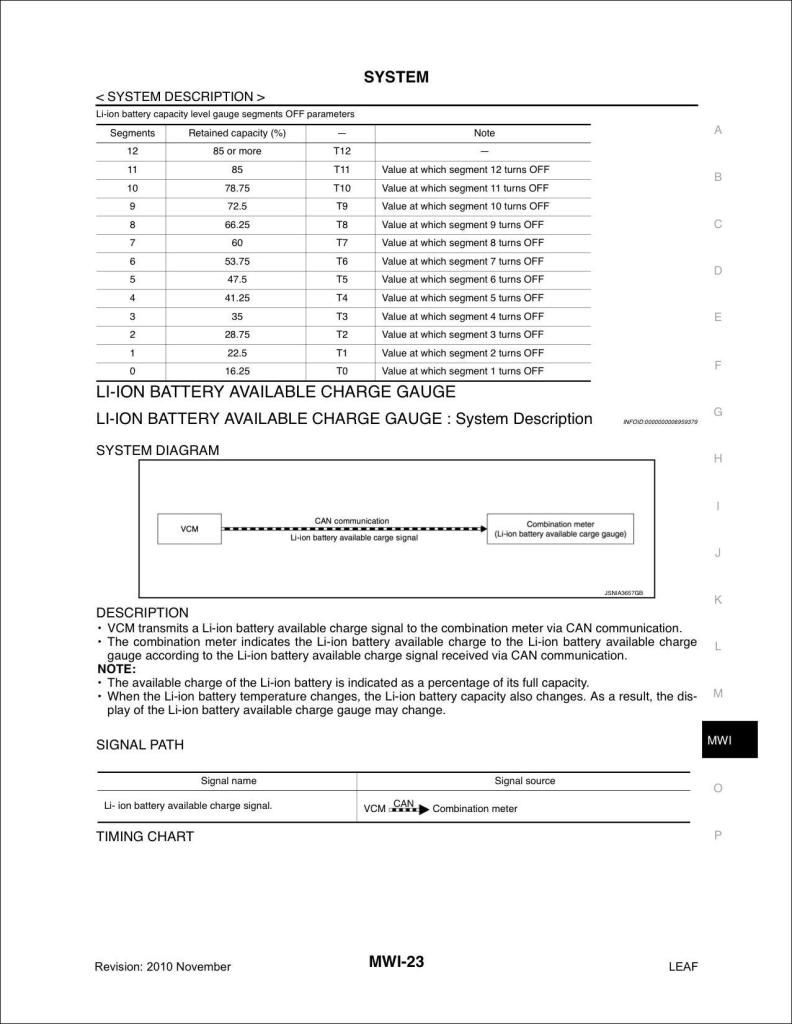
When the battery pack loses capacity, bars begin to disappear from the “capacity gauge” (thin 12-segment gauge to the immediate right of the 12-segment state of charge gauge). The first known Nissan LEAF to have its battery pack replaced was reported in November 2011 when an owner in the Phoenix area reported a missing battery capacity bar on the dash instrument and reduced range. Now you see the only EV with no liquid cooling has the best warranty. Let’s identify what the Leaf capacity bars tell us about battery health.
- 100% to 85% = 12 bars (15% or 2.4 times a “normal” bar)
- 85% to 78.75% = 11 bars (6.25%)
- 78.75% to 72.5% = 10 bars (6.25%)
- 72.5% to 66.25% = 9 bars (6.25%)
- 66.25% to 60% = 8 bars (6.25%)
- 60% to 53.75% = 7 bars (6.25%)
- 53.75% to 47.5% = 6 bars (6.25%)
- 47.5% to 41.25% = 5 bars (6.25%)
- 41.25% to 35% = 4 bars (6.25%)
- 35% to 28.75% = 3 bars (6.25%)
- 28.75% to 22.5% = 2 bars (6.25%)
- 22.5% to 16.25% = 1 bar (6.25%)
- 16.25% to 0% = 0 bars (16.25% or 2.6 times a “normal” bar).
Technically, lithium battery calendar life is a function of 4 variables:
- Mean temperature
- Standard deviation of temperature
- Mean state of charge (SOC)
- Standard deviation of SOC
Surfingslovak reported on how the depth of discharge (DOD) affects the rate of battery capacity loss: “The closest thing I found was a JPL report for the Mars Rover mission. They found the capacity fade from cycling to be about six times higher at 60% DOD when compared to 30% DOD. They used SAFT LiNiO2 cells with graphite anode and cylindrical stainless steel hardware. The cells were tested in a 30% DOD regime (5000 cycles) with an average energy fade rate of 4.0V at 0.000704% per cycle and a 60% DOD regime (500 cycles) with an average energy fade rate at 4.0V at 0.00430% per cycle.”Another report, which does not specify the specific battery chemistry, shows a graph of the remaining battery capacity vs the number of cycles. The results (with cycles normalized to full-cycle in parentheses):
- 100% to 0% – 1200 cycles (1200 cycles)
- 100% to 80% – 12000 cycles (2400 cycles)
- 80% to 0% – 5000 cycles (4000 cycles)
A DOD of 80% made the battery last 3.3 times longer than a DOD of 100% (but remember that the Leaf limits battery use to some extent, allowing limits of SOC of 95% on the high end and 2% on low end).

Surfingslovak also developed a rough model to estimate how much capacity loss you may expect to see for your particular geographic location and planned annual mileage. Stoaty refined the spreadsheet model to match Nissan’s data obtained by TickTock in his discussion of Casa Grande testing with a Nissan engineer.
Battery Aging Model assumptions:
- Both calendar capacity loss and cycling capacity loss are temperature-dependent
- Calendar capacity loss is proportional to the square root of time (e.g., 2 years would give 1.41 times the degradation seen at one year, meaning the second year would have 41% of the calendar loss of the first year)
- Solar loading loss (i.e., parking the car in the sun) was estimated based on a study of the Prius battery (
 ) and scaled using average annual solar radiation from the NREL:
The original version of the battery aging model was tuned empirically to reproduce as closely as possible TickTock’s graph of Nissan data. In order to fit the graph, it was discovered that the following additional assumptions were necessary:
- Calendar loss for the first year was 6.5% for the city with a “normal” temperature
- Cycling loss for the “normal” city was 1.5% for every 10,000 miles driven at 4 miles per kWh
- Driving more efficiently than 4 miles per kWh would cause less cycling of the battery pack and reduce cycling loss proportional to the increase of efficiency. Conversely, less efficient driving would increase cycling loss
- The Phoenix Arrhenius aging factor slightly overestimates the hot climate aging; it was necessary to scale the aging factors to fit Nissan’s data. Note: The adjustment required the high aging factors like Phoenix to be scaled back (roughly 1.8 -> 1.5 for Phoenix on the scale we were using), although the model has the values adjusted to a slightly different baseline of 0.9 for “normal”, so the actual scaled value for Phoenix is 1.35
The graph and predictions of the Battery Aging Model are shown below:
The model was recently (October 2013) updated and calibrated using Ah capacity measurements from Leaf Spy or the LeafDD. Using data reported from 22 Leafs (2011-2012 model years only, since the battery electrolyte was “tweaked” for 2013 Leafs), several changes were made to calibrate the model to fit the actual data:
- It was discovered that scaling the aging factors for cities with climates warmer than Los Angeles caused the prediction to underestimate the actual loss. Therefore, unscaled aging factors were used for these warmer climates
- Calendar loss was changed to 6.9% for the first year for the city with “normal” temperature (empirically derived to best fit the actual capacity loss data)
- Cycling loss for the “normal” city was changed to 2.0% for every 10,000 miles driven at 4 miles per kwh (empirically derived to best fit the actual capacity loss data)
- A correction factor was added to account for the fact that as the battery capacity diminished more full cycles would be necessary to drive a given distance (all other parameters being equal)
Super credit to Battery Wiki for compiling the above information. Application of these are largely valid to the Sri Lanka context for Gen 1 and Gen 2 Leaf, produced until late 2013.
Fantastic explanation of the Leaf batteries and what to expect over a period of time.
Thank you very much.
My 10 year old leaf has 77% soh, 130000 miles and still in good overall condition. Best buy ever, still get another 50 000 miles out of it.