A Strategy for Economic Prosperity whilst Overcoming Forex Crisis with Health and Environmental benefits.
Colombo needs a transformation in mobility. There are some ongoing & upcoming projects at the forefront. These include an LRT or similar, Urban highways, Upgrades to diesel locomotives, Electrified railways on existing lines, BRT & dedicated bus lanes, Water transport system on City canal networks, Expressways, and the outer circular line.
However, there are massive challenges with slowing down traffic flow at 15 kmph, lack of space for additional routes and widening, increasing number of private cars, and funding required in transport modernization.
This paper proposes the seventh mode mitigating all the above challenges, dedicated bicycle lanes along roadways, railways, and canals in and around the city. This is challenging both physically and psychologically. The paper addresses the quantification and cost-benefit analysis of practical modeling.
An Investment Opprtunity too!
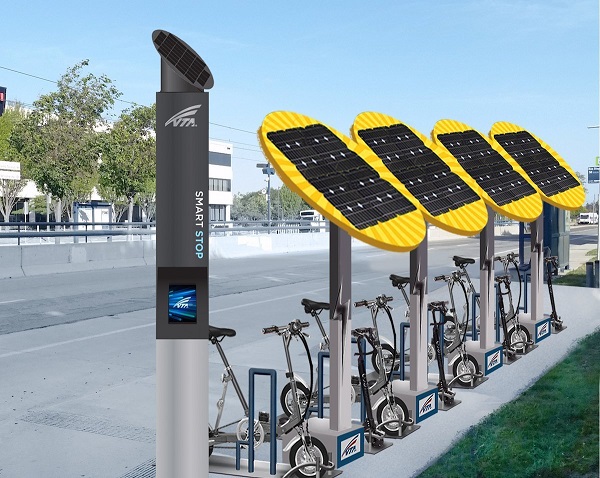
Not only a socio-economic venture, we think further in making this a direct investment as well by adding a Solar roof to generate energy. This will be a bonus, providing shelter to attract more car owners to shift their mode of mobility. True that the Government and the Society at large get a massive return just by deploying the project. Still, there is a super investment opportunity to any to reap benefits over a green initiative, guilt-free business, whilst taking the burden of public funding.
Let’s start from the background and the need analysis, towards the ROI.
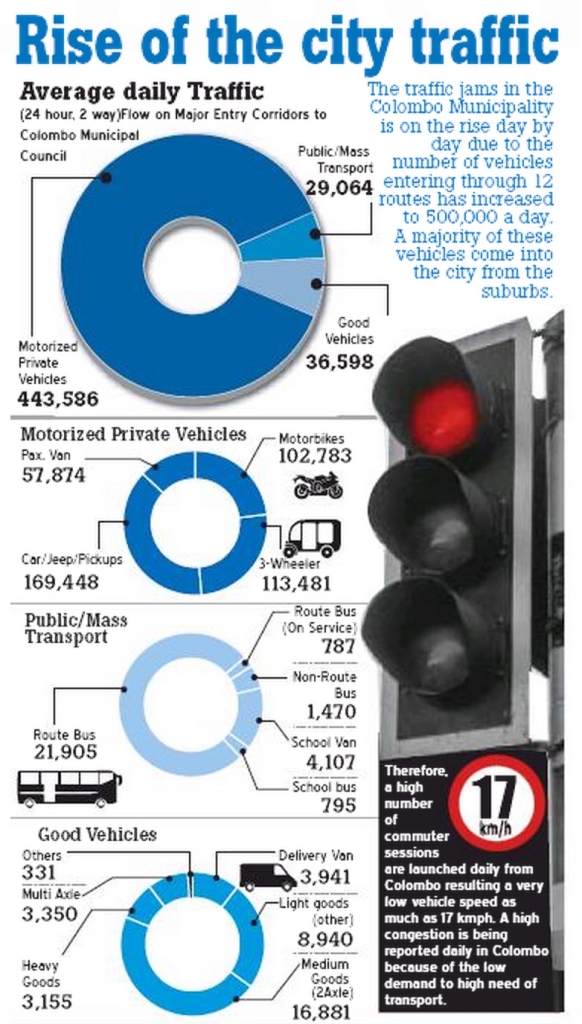
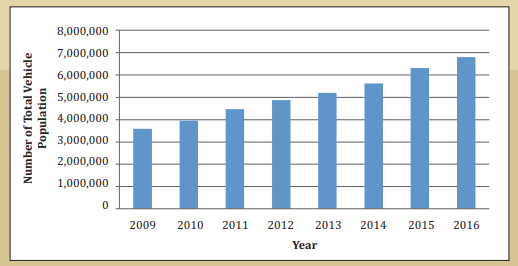
The congestion in the commercial capital has now been expanded to the suburbs through six key corridors. For the purpose of this paper, we identify these corridors starting from Moratuwa, Piliyandala, Kottawa, Kaduwela, Kadawatha, and Kandana. The six current and traditional transport measures identified in the abstract now work towards mitigating the problem although the numbers do increase rapidly. An average of 250,000 vehicles enters Colombo on a standard workday according to a study of 2012 [1].
This has been re-validated by a latter study where 443,586 private vehicles pass through major entry corridors in the city daily. [4]
The impact on the economy and environment had been well quantified by the experts. Still, there are several variances as the years go by.
The problem of congestion is due to the increase in vehicles, when average speed decreases, leading to longer travel times, causing a rise in pollution levels. Hence the economic loss due to congestion rises steeply.
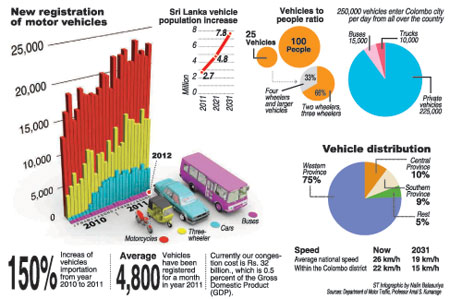
As of 2012 the annual congestion cost has been quantified as Rs. 32 billion, which is 0.5% of the Gross Domestic Product (GDP), which is likely to increase by 2% of GDP further.
THEN AGAIN IN 2019, IT HAS BEEN NOTED THE COST OF COLOMBO’S CONGESTION IS A STAGGERING BILLION RUPEES A DAY. [3]
The 2012 study states the fuel bill is about 6% of GDP, and that is likely to increase to 8%. All this will become an economic burden for the country. We have a densely populated country and need to design our transport system to suit that.
We cannot design our road systems purely with expressways, elevated highways, and flyovers. Those solve isolated individual problems, but in terms of a network solution, it should be a solution that helps everybody, by implementing a pro-public transport policy. [2]
Furthermore, the city is developing another crisis. Colombo uses 15% of its land on transportation needs. If we promote cars and other vehicles, neglecting public transport, we will need three times more space than we have now. This is not practical at all and will become a gridlock eventually.
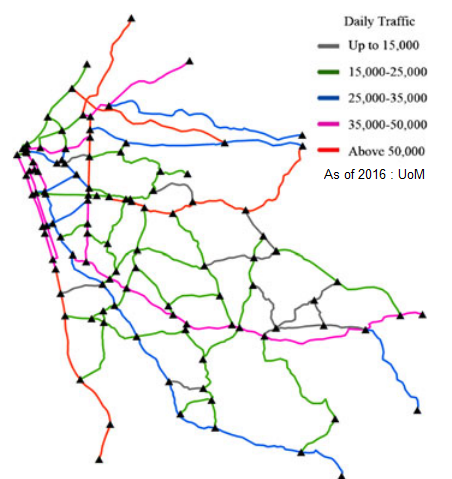
The Traffic Network
- Galle Road along Panadura Moratuwa, Dehiwala,Col 3.
- Horana road along Kesbewa Piliyandala, Havelock town, Fort.
- Highlevel Road along Kottawa Maharagama, Nugegoda,
- Along New Kandy road via Malabe connecting planned Parlimant Portcity drive.
- Low-level road along Kaduwela, Kotikawatte, Rajagiriya
- Kandy road along Kadawatha, Kelaniya, Dematagoda
- Negombo Road along Jaela, Wattala, Modara,
All the outer roads linking the city are chock-a-block with traffic most of the time, not only during office and school rush hours but always and both ways. Even some recent measures like flyovers, road widening, single pile flows, Bus lanes, etc have not paid off or not even made an impact.
It would sometimes take a whole hour, for example, moving from Nugegoda-Kohuwala to Lipton Circus (a distance of around 7 km). The time from Dehiwala, Maharagama, Malambe, Kiribathgoda and Wattala has no difference. This is becoming the norm or worse day by day.
The city has three key transport methodologies across all six corridors, namely private transport, busses, and railways. Soon we will see the addition of LRT, BRT, and Outer circular highways and we already started seeing the transport along waterways.
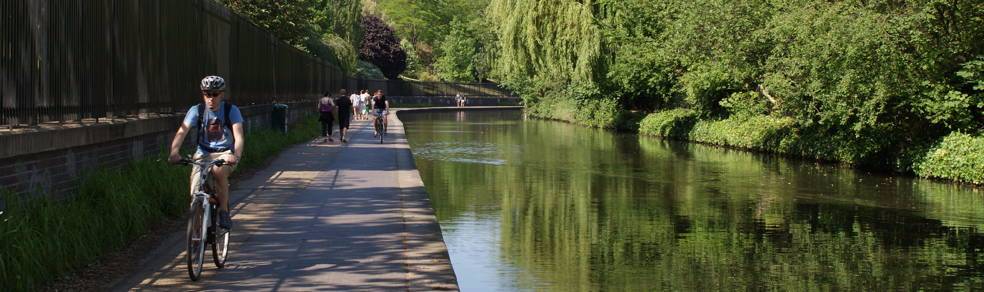
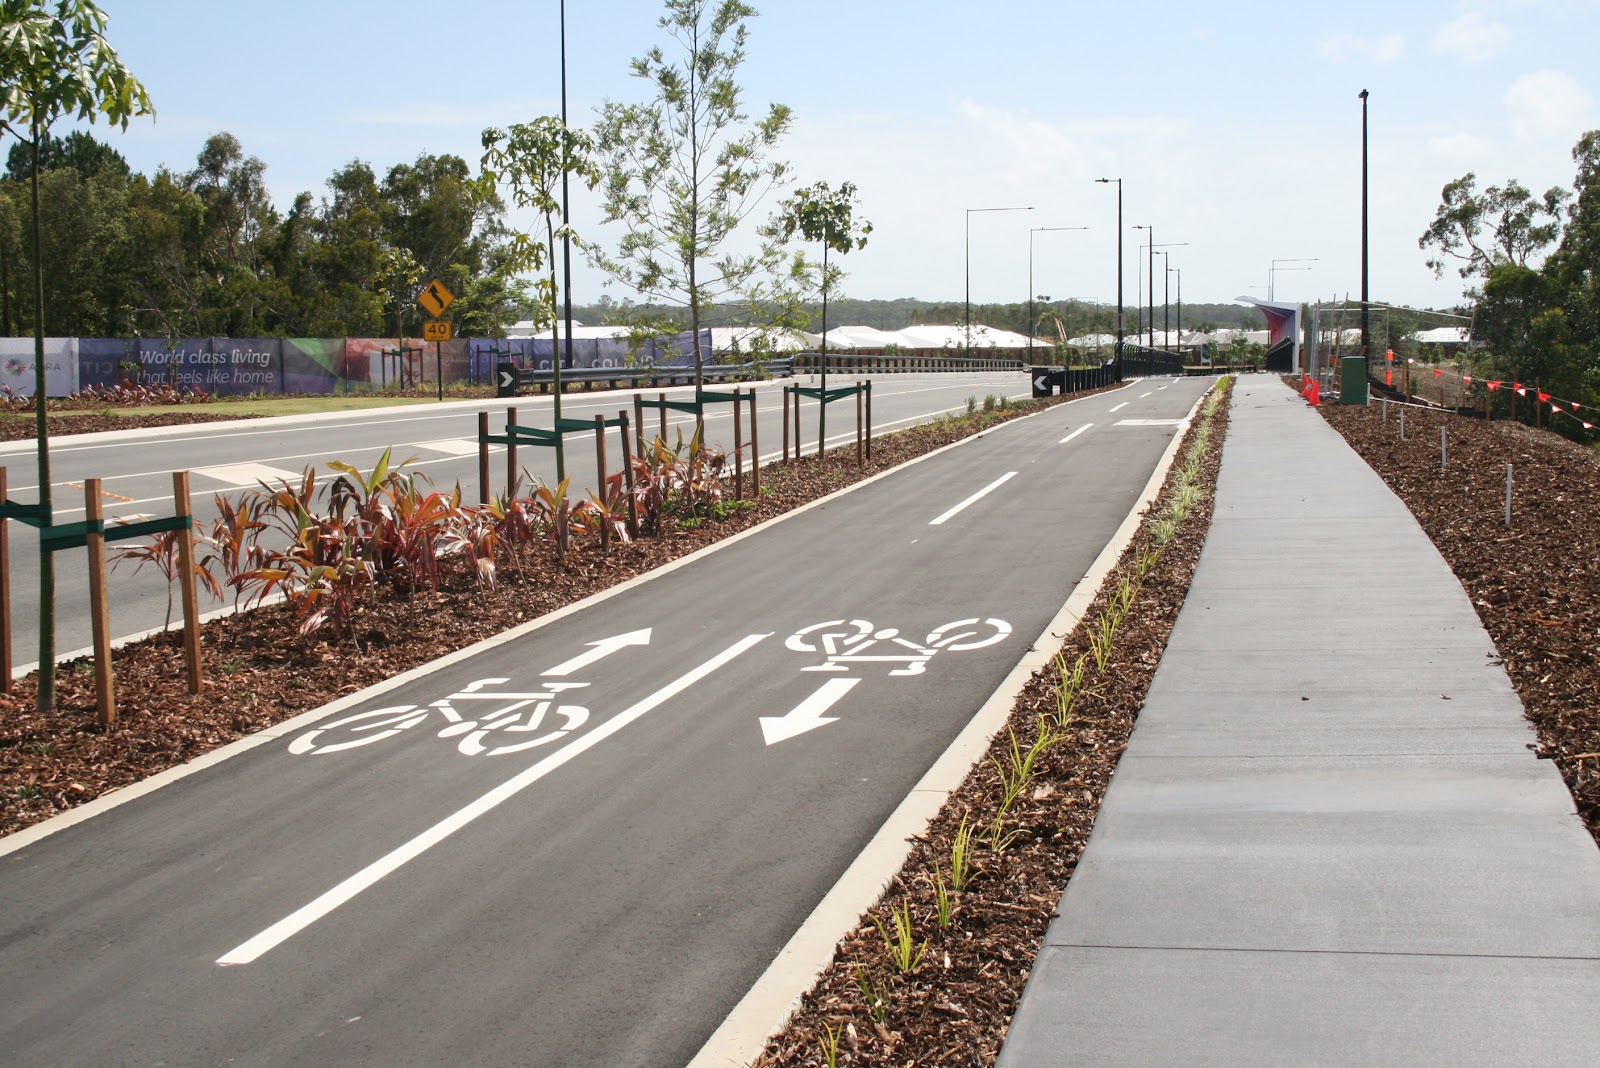
Bicycle Paths along City Entry Corridors
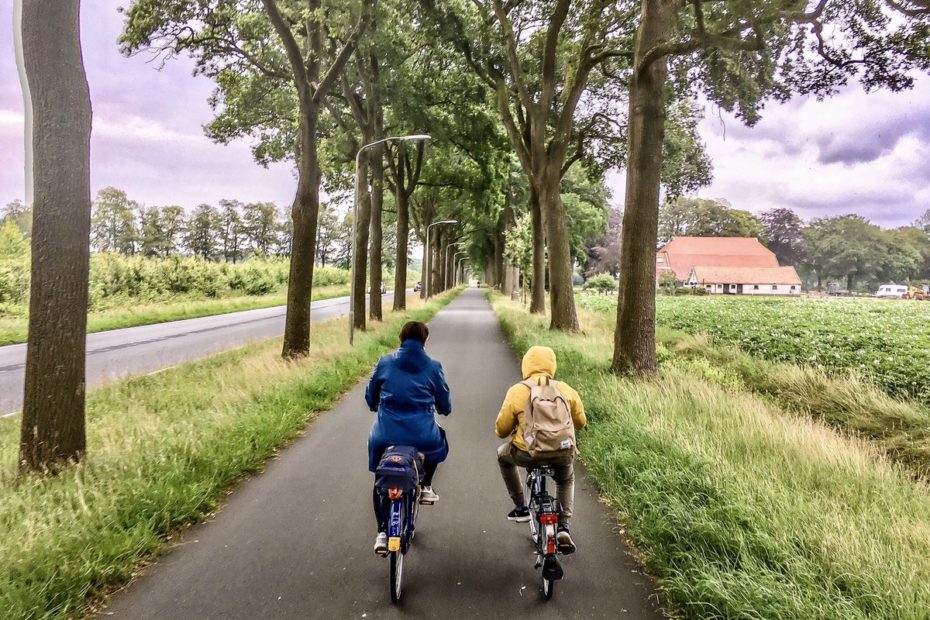
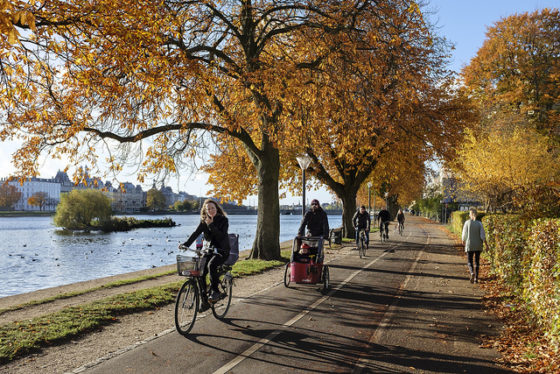
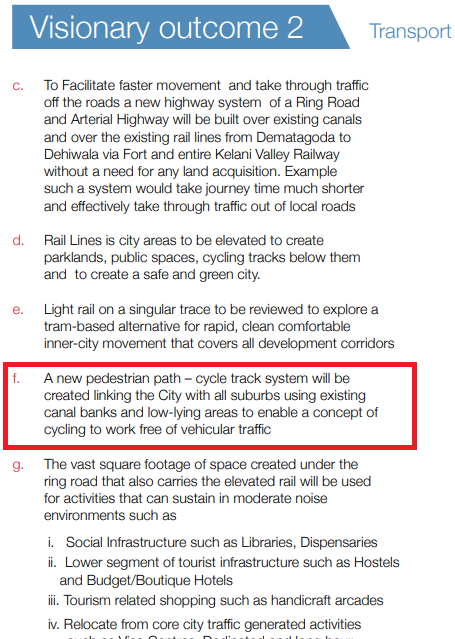
The Greater Colombo area is a great place for cycling due to its elevations. This paper now proposes to have cycle pathways covering all six corridors and Interchanges, along with canals, railway tracks, and roadways.
Additionally, the paths can have a tree shade, doubling the impact on minimizing the city’s carbon footprint.
The cost of congestion has been considered a billion rupees a day in Colombo. Also, the vehicles entering Colombo have been recorded as 500,000 in recent times, almost doubling the study done in 2012. More importantly, these carry 1.8 million passengers to the city[4]
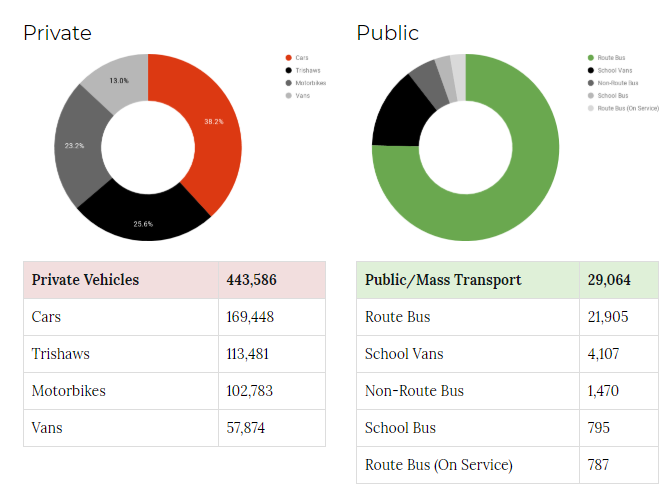
This arrives at the conclusion each private vehicle carries an average of 1.87 people. Each bus carries 33.6 people. This is to say only 56% of the passengers use public transport and 44% uses private modes.
The proposal suggests a conversion of at least 10% of the vehicles to use bicycles as their prime medium of travel to work for 5 days a week.
We anticipate the implementation of the full program will enable a 10% conversion within 12 months period.
| Private vehicles enter the city daily | 443,586 |
| The proposed reduction of vehicles | 10% |
| Reduction of vehicles | 44358.6 |
| Number of cyclists (x 1.8) | 79845.48 |
This suggests a conversion of 10% of the private transport will create 79,845 cyclists travel to the city, daily.
However, this number will be higher once considered with the inflow from public transport as well. But we move forth only with the private, in evaluating the economic benefits for now.
Prior to moving the project plan and the financials we hereby evaluate the economic cost-benefit of the cycling pats to the passenger (internal) and the government (external). Although there’s no modeling developed locally, we elaborated upon a Danish model in the local context. [5]
Economic Cost Benefit Analysis in Sri Lanka
Cycling Vs Passenger Cars with CPK:
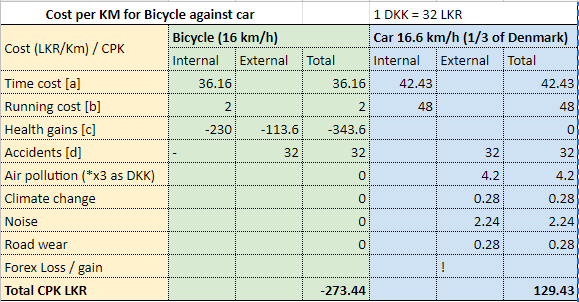
[a] Car time cost [2.21DKK/5 time, less hourly cost x 3(thrice slower traffic) x e.rate]
[b] Bicycle and gear worth LKR 50,000 used for 25,000 Kms with maintenance
[b] Car CPK Toyota Prius: https://mobility.lk/2019/08/22/cost-of-km-ev-hybrid/
[c] Denmark cost x exchange rate (1 DKK = 32 LKR)
[d] Differing to Denmark Accident cost to the state has taken as equal to Car or Bicycle user
Internal: cost to the user | External: cost to the state
Here we arrive at a per kilometer cost of LKR 129.43 per car entering the city and a Minus cost (benefit) of LKR 273.44 per bicycle entering the city.
This is an overall cost-benefit of LKR 402.87 per KM traveled by bicycle.
Let’s convert the above cost-benefit to the projected 10% conversion,
- Assuming a cyclist ride 20 kilometers on average (10×2) a day.
- 10% conversion means 79,845 people x 20kms x 402.87 LKR.
Generating a Daily Cost-Benefit of 643,343,103. LKR
Let’s get to the case of Denmark again, The analysis shows that if 10% more kilometers are cycled there will be an annual socio-economic gain in Denmark of DKK 1.1 billion (€ 150 mil.). In the capital region, the annual gain will be approx. DKK 0.5 billion (€70 mil.). *Exchange rate 1DKK = 28 LKR
For purposes of comparison, the Danish regional health authorities spend approx. DKK 15.3 billion (€ 2 billion) annually on general doctor-practices.
In a situation where Sri Lanka’s medical expenditure is not covered by insurance companies, a Sri Lankan analysis will gain much higher socio-economic benefits. As a fact we are aware, our annual health bill is over 600 Billion a year [7]
Converting 10% of Car users to Bicycles will earn back half of the total daily Cost of Congestion!
Not only, a bicycling infrastructure will generate other avenues of income as well. After investing in proper bicycle infrastructure, North Carolina’s Outer Banks region generates $60 million annually in economic activity through bicycle tourism. [6]
The latter part of the proposition identifies several socio-economic benefits along with the cycle of tourism.
Let’s look at what we need to get us there, and the cost of capital. This needs to be segregated into several measures. Regulatory, Infrastructure, and Attitudinal, addressing Safety, Convenience, and Comfort zones.
Construction, CAPEX
In Sri Lanka, a B-class road is costing 100 LKR per Km [8], whilst a renovation is costing LKR 20M as per the RDA. However, according to the world bank, a single-lane road is costing approx 1M USD per km in less developed countries [8], 180M LKR. No purpose-built cycle paths have been built in Sri Lanka as yet, hence we again consider a global scenario.
It is estimated In the USA on average, urban freeways cost $60 million a mile to build. The best type of protected bike lanes cost $ 210,000 on average per mile and need much less maintenance. [9] This shows us an international standard cycle path is costing just 1/285 of along an urban road.
This equation leaves a cost of LKR 701,750 per Km to build a protected bicycle path.
A Network of 175 Kms (25 km x 7) of Bicycle Paths along 7 corridors can be constructed @ a cost of 123 million LKR.
This is highly notable, the investment will reap its benefits in no time, once considered with all socio-economic benefits, direct and indirect (internal and external).
It is to be noted the above costs only include the construction costs, along existing roadways. No land acquisition costs were considered if any.
But the plight doesn’t end here, the infrastructure is needing several other accomplishments.
The good thing is in the rest of the areas the expenditure on the Government can be nominal, while the private sector will willingly and actively take part in, being the highest affected party of the congestion.
We addressed the safety of cyclists with the paths, also the convenience and comforts to a greater extent. Still, it is needing to have the following requirements to make the cycling ecosystem completed.
Value Additions!
- The laws on cycling and cyclists are very primitive and hasn’t been changed for decades. Increased number of cyclists will be needing a regulated manure for the safety of both cyclists, pedestrians and motorists.
- Parking facilities on all public and private institutions. Not a major issue as the accessibility requirement is limited, but the projected number of almost 100,000 cycles entering the city daily it is needing a special arrangements. However this can be easily compensated by the reduced number of car parking requirements.
- Parking facilities will be a mandatory need in multi modal transport hubs.
- Shower, changing and locker facilities in all private and public buildings, need to be requirement from the planning stages, including the parking.
- Bicycle carrying facility on LRT, BRT, Trains and Watercrafts.
- Trees along the cycling paths, multiple benefits at once.
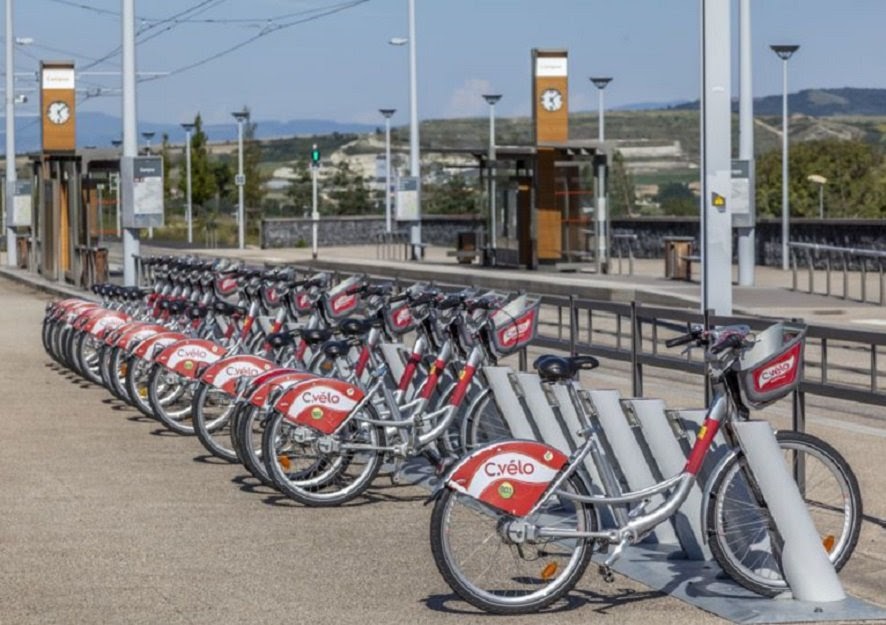
- Bicycle and electric Bicycle rentals – last mile mobility (replacing tuk tuk)
- Licencing procedures. To implement only after first 5 years avoiding unnecessary costs and hassle
- A solar roof for cycling highways, making the whole project a sustainable business venture as well!
Challenges
Attitude towards cycling is a bigger challenge as it’s perception as a poor man’s car. But there are many good signs, already there are elite cycle clubs on the island and also several stores dedicated to high-end cycling. This is a great sign in preventing it from being the game of Football in Sri Lanka but Rugby.
Heat, Safety, Vehicular emissions, and Dust are subjective, a developed infrastructure will address it all.
Furthermore, being in the tropics we can have some covered paths, especially with trees adding double benefits being net zero carbon urban transportation.
Key Economic Benefits of Cycling improving GDP, Sustainably.
Cycle Tourism
We spoke of bicycle tourism. We are in the tropics, and the westerners love the sun and the heat. It is noted that the turnover of bicycle travel and tourism is three times as high as the bicycle production industry – 100 bn US Dollar globally. The industry is growing (43% increase in mobile searches for bicycle tours during 2017), there’s a lot of unmet demand and the industry is highly fragmented. [10]
Further study on this is required as the growth potential is heavy as the country focuses on many tourism-related businesses including eco, sports, health, and agro.
New business opportunities will generate by linking Suburbans, historic sites, and the coastal belt. The cities like Polonnaruwa, Anuradhapura, Galle, Jaffna, etc already provide great provisioning for both tourist and local cycling.
Production Economy Growth
Sri Lanka is a non-car-producing economy. In this scenario, the country needs to consider the number of rupees that remain in the local economy. Having no local studies we consider the case of Holland and Denmark are non-car-producing countries.
Holland has carried out studies to determine what this means for the economy. In Holland consumption of cars and fuel are not necessarily economic gains.
Cars and oil are import commodities in Holland, which means that financing and subsequent employment do not take place in Holland.
Cycling on the other hand requires neither imported cars nor imported fuel. Sri Lanka already produces bikes and does export as well, an industry that has a much higher potential to grow.
The study shows [5]: For every Euro spent on fuel, only 4% remains in the local economy. For every Euro a cyclist spends, 32% remains in the local economy.
Sustainable Last Mile Solution
Reducing the impact of negative economies including Tuk Tuks. Removing the significance and adding the youth workforce to the more productive economy.
Automated cycle rentals, pay and go models will be the popular ones provided with the necessary infrastructure.
The Investment Opprtunity
We repeat, not only a socio-economic venture, a Solar Roof will make the road a direct investment as well by adding a Solar roof to generate energy. This will be a bonus, providing shelter to attract more car owners to shift their mode of mobility. We forecasted here of converting 10% but having a solar roof will get 20% of the motoring community, or even more, we are confident!
True that the Government and the Society at large get a massive return just by deploying the project. Still, there is a super investment opportunity to any to reap benefits over a green initiative, guilt-free business, whilst taking the burden of public funding.
It’s not a bit, One Kilometer of Cycling path will generate beyond 2,000 MWh, read more here!
Conclusions
It is evident that the multiple benefits of cycling, rather cycle to work along with the topic overweight and earn its expenditure in no time.
The next steps would be developing an action plan, prioritizing the identification of the exact route along with the existing roadways, railways, and canals. In carrying out this task several government institutions’ involvement is required.
Land acquisition needs will be a bare minimum as the canals and railways will be already having the required by law.
Being away from the roadways will be to the liking of the cyclists due to the high emission levels of our vehicle populations. Car electrification will be taking place within the next decade even in Sri Lanka and the road network is ready with the necessary cycling paths then.
Urban Development Authority and the Road Development Authority can be the best institutions for implementation.
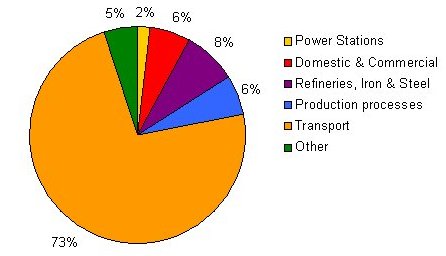
Reemphasizing, transport-related pollution is the highest in most parts of the world, needless to say addressing it will mitigate the problem most.
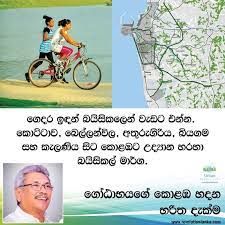
President Gotabaya Rajapakse too proposed cycling highways along all entry corridors to the capital city in his pre campaign documentation.
It is to be noted that this proposal has been developed prior to pandemic. Needless to mention the value of Micro mobility in mitigating the adverse effects of both pollution and pandemic.
Its now or never!
Appendix: UIO: Units In Operation | TCO: Total Cost of Ownership | CPK: Cost Per Kilometre
Sujeeva Premaratne | sujeeva@mobility.lk | mobilitysrilanka@gmail.com
Micromobility, in this case, cycling highways are needs to be a part of a National Transport Policy. Here is our outline for a National Policy of Mobility.
References
- [1] SLIDA MPM 2012/2014 -05 Managing traffic congestion in Colombo and suburbs. D.U.A Edirisinghe
- [2] Sunday Times February 12, 2012, Prof Amal Kumarage
- [3] Financial Times 26.3.2019 . Reporting Parliament Speech Minister of megapolis
- [4]https://indi.ca/2015/10/colombo-vehicle-statistics-2015/
- [5]https://cyclingsolutions.info/cost-benefit-of-cycling-infrastructure/
- [6]https://www.aarp.org/content/dam/aarp/livable-communities/old-learn/transportation/economic-benefits-bicycle-infrastructure-report.pdf
- [7]https://knoema.com/atlas/Sri-Lanka/topics/Health/Health-Expenditure/Real-expenditure-on-health
- [8]Prof;AmalKumarage,http://www.sundaytimes.lk/141221/Cost%20of%20Expressways.pdf
- [9]https://www.fastcompany.com/3021074/making-the-economic-case-for-cycling-friendly-cities-with-bikeonomics
- [10]https://ecf.com/news-and-events/news/velo-city-day-3-cycle-tourism